| Information component |
Pg 4 Health Summary – Indicator No 2 |
| Subject category / domain(s) |
Our Communities |
| Indicator name (* Indicator title in health profile) |
*Ecological Footprint |
| PHO with lead responsibility |
WMPHO |
| Date of PHO dataset creation |
13th Feb 2007 |
| Indicator definition |
The amount of productive space required to support the resource requirements and waste production for the average person measured in global hectares per person per year |
| Geography |
England, GOR, Local Authority: Counties, County Districts, Metropolitan County Districts, Unitary Authorities, London Boroughs |
| Timeliness |
Published by Stockholm Environment Institute (SEI) and created by their Resource and Energy Analysis Programme (REAP) SEI will update data annually. They hope to publish 2003 0r 2004 data in 2008. |
|
Rationale:What this indicator purports to measure
|
This is an indicator of sustainability from the population perspective. It is a proxy measure based on regional household expenditure, modelled at LA level by socio-economic profile.It represents the environmental “cost” (resource use and environmental degradation) associated with people’s lifestyle choice and the goods and services they buy. If everyone in the world was to make the same lifestyle decisions as the average person in the UK we would need three planets to provide the resources required. |
|
Rationale:Public Health Importance
|
There is a close relationship between environmental problems and social injustices, which arises from inequity in access to environmental resources and increased exposure to environmental hazards and pollution. Comparing countries and different groups within countries, the main contributors to this environmental degradation are the relatively affluent while those who suffer are the most vulnerable groups in society.With the increasing impact of climate change, particularly in developing countries, this baseline footprint in the developed world will need to be reduced to ensure good health for future generations in all parts of the world. Creating more sustainable communities is therefore a public health priority.In general, public health and cross-sector interventions, particularly those which impact on the wider determinants of health, are likely to decrease the local footprint. For example, encouraging walking and cycling, increasing availability of locally-produced fruit and vegetables and enabling home insulation. There is evidence that healthier diets can reduce the food component of the footprint by up to 40%http://www.sei.se/editable/pages/sections/implement/scotland-diet.pdf |
| Rationale: Purpose behind the inclusion of the indicator |
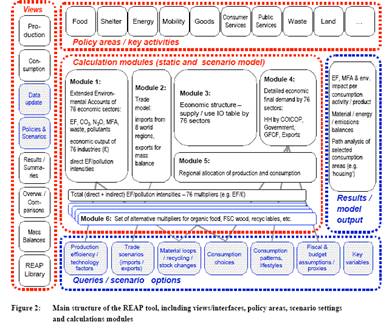
The broader REAP model helps identify priority areas for action, allows for forecasting the effects of interventions and explores links between income and environmental impact. Source:http://www.wwflearning.org.uk/data/files/reap-report-no-2-83.pdf. The local authority indicator alone or disaggregated into its component parts may be used as a baseline and for tracking change resulting from targeted interventions.For more detailed suggestions of how local authorities can make use of the footprint information, an account of the experience of Scottish Las is at:http://www.scotlandsfootprint.org/pdfs/SGF_Final_Report.pdf |
|
Rationale:Policy relevance
|
The use of this sustainability indicator as the basis for policy and decision making at LA level is in line with the government guidance Securing the Future (March 2007) http://www.sustainable-development.gov.uk/publications/pdf/SustainableProcurementActionPlan.pdf.A number of UK councils have signed up to the Aalborg Commitments framework, see for example, Hampshire County Council http://www.sd-commission.org.uk/communitiessummit/show_case_study.php/00201.html. And guidance for local government is available at http://www.sd-commission.org.uk/publications.php?id=507. The Sustainable Development Commission has published numerous reports with relevant guidance includingThe Environmental dimension of children and young people’s well beinghttp://www.sd-commission.org.uk/publications.php?id=518 and Sustainable transport and active travel http://www.sd-commission.org.uk/publications.php?id=501 |
| Interpretation: What a high / low level of indicator value means |
To understand the meaning of this composite indicator, it is important to look at the breakdown analysis by following the links athttp://www.sei.se/reap/local/LocalAuthority_List.php. For example a high ecological footprint may be due to high overall spending, high spending on one category such as food, or relatively high spending on a category with a disproportionate impact, such as heating. It is important to interpret the Ecological Footprint in global terms. Globally there is estimated to be 1.8 global hectares of productive space per person. A Local Authority may be low compared to the England average but is in fact very high when considered globally. |
| Interpretation: Potential for error |
Footprints calculated using this methodology may differ from local ecological footprinting carried out using less complex, life-cycle methodologies. This is not a cause for concern. The footprints used here are likely to provide a better basis for decision making at local authority level because they take into account upstream production processes and therefore more accurately reflect the environmental impacts of consumption and the allocation of responsibility.The method used by SEI makes certain assumptions: it treats imports the same as domestic product supply in terms of monetary value and it applies uniform carbon dioxide intensity to the production of imported goods. There is a very small amount of error introduced by the assignment of all secondary products to industry-based technology. There are limitations to using the data for forecasting because coefficients (input-output) will change over time. |
| Confidence Intervals: Definition and purpose |
Not applicable |


 Further information on inputs may be found athttp://www.wwflearning.org.uk/ecological-budget/